Non-random, locus-specific differences in DNA accessibility are present in homologous metaphase chromosomes. W. A. Khan1,3, P. K. Rogan2,3,4, J. H. M. Knoll1,3,4 1) Department of Pathology; 2) Departments of Biochemistry and Computer Science; 3) University of Western Ontario, London, Ontario, Canada; 4) Cytognomix, London, Ontario, Canada.
/
Condensation differences between heterochromatin and euchromatin along the lengths of homologous, mitotic metaphase chromosomes are well known. This study describes differences in metaphase compaction between homologous euchromatic loci. We report molecular cytogenetic data showing local differences in condensation between homologs that are related to differences in accessibility (DA) of associated DNA probe targets. Reproducible DA was observed at ~10% of 450 distinct genomic regions mapped by single copy fluorescence in situ hybridization (scFISH). Fourteen short (1.5-5kb) sc and low copy (lc) FISH probes (from chromosomes 1, 5, 9, 11, 15, 16, 17, 22) targeting genic and non-genic regions with and without DA were developed and hybridized to cells from 10 individuals with cytogenetically-distinguishable homologs. Differences in hybridization were non-random for 6 genomic regions (RGS7, CACNAB1, HERC2, PMP22:IVS3, ADORA2B:IVS1, ACR) and were significantly-biased towards the same homolog (p< 0.01; n = 355 cells). The imprinted paternal chromosome 15 in a three-generation pedigree also showed non-random bias in DA. DNA probes within CCNB1, C9orf66, ADORA2B:Ex 1-IVS1, PMP22:IVS4-Ex 5, and a nongenic region within 1p36.3 did not show DA, while OPCML showed unbiased DA. A subset of probes was mapped onto chromosome topography by FISH-correlated atomic force microscopy (AFM). To quantify DA and pinpoint probe locations, we performed 3D-structured illumination super-resolution microscopy (3D-SIM). 3D anaglyph videos showed genomic regions with DA having nearly 5-fold larger differences in volumetric integrated probe intensities between homologs. Additional non-DA probes (NOMO1, NOMO3) hybridized to grooves in chromosome topography and exhibited a narrow range of probe depths (average: 0.08 μm) along axial and lateral axes of the 2 homologs. In contrast, probe for targets with DA (HERC2, PMP22:IVS3, ACR) significantly differed in probe depth (average: 0.77 μm) and volume (p < 0.05) between each homolog. Interestingly, genomic regions without DA are enriched in epigenetic marks (DHS, H3K27Ac, H3K4me1) of accessible interphase chromatin to a greater extent than regions with DA, suggesting these differences may be correlated with epigenetic marks established during the previous interphase. In summary, we present several lines of evidence that regional differences in condensation between homologs are programmed during metaphase chromosome compaction.
Click here for presentation details: session, location, time.


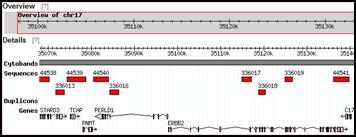
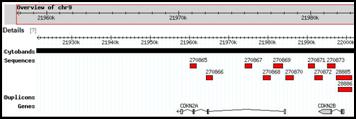
 Snapshots of predesigned SC-FISH probes from selected regions of chromosomes 9 and 17